|
| enum | CurveStyle {
NoCurve = -1,
Lines,
Sticks,
Steps,
Dots,
UserCurve = 100
} |
| |
| enum | CurveAttribute { Inverted = 0x01,
Fitted = 0x02
} |
| |
| enum | LegendAttribute { LegendNoAttribute = 0x00,
LegendShowLine = 0x01,
LegendShowSymbol = 0x02,
LegendShowBrush = 0x04
} |
| |
| enum | PaintAttribute { ClipPolygons = 0x01,
FilterPoints = 0x02,
MinimizeMemory = 0x04,
ImageBuffer = 0x08
} |
| |
|
typedef QFlags< CurveAttribute > | CurveAttributes |
| | Curve attributes.
|
| |
|
typedef QFlags< LegendAttribute > | LegendAttributes |
| | Legend attributes.
|
| |
|
typedef QFlags< PaintAttribute > | PaintAttributes |
| | Paint attributes.
|
| |
| enum | RttiValues {
Rtti_PlotItem = 0,
Rtti_PlotGrid,
Rtti_PlotScale,
Rtti_PlotLegend,
Rtti_PlotMarker,
Rtti_PlotCurve,
Rtti_PlotSpectroCurve,
Rtti_PlotIntervalCurve,
Rtti_PlotHistogram,
Rtti_PlotSpectrogram,
Rtti_PlotSVG,
Rtti_PlotTradingCurve,
Rtti_PlotBarChart,
Rtti_PlotMultiBarChart,
Rtti_PlotShape,
Rtti_PlotTextLabel,
Rtti_PlotZone,
Rtti_PlotUserItem = 1000
} |
| | Runtime type information. More...
|
| |
| enum | ItemAttribute { Legend = 0x01,
AutoScale = 0x02,
Margins = 0x04
} |
| | Plot Item Attributes. More...
|
| |
| enum | ItemInterest { ScaleInterest = 0x01,
LegendInterest = 0x02
} |
| | Plot Item Interests. More...
|
| |
| enum | RenderHint { RenderAntialiased = 0x1
} |
| | Render hints. More...
|
| |
|
typedef QFlags< ItemAttribute > | ItemAttributes |
| | Plot Item Attributes.
|
| |
|
typedef QFlags< ItemInterest > | ItemInterests |
| | Plot Item Interests.
|
| |
|
typedef QFlags< RenderHint > | RenderHints |
| | Render hints.
|
| |
|
| | QwtPlotCurve (const QString &title=QString::null) |
| |
| | QwtPlotCurve (const QwtText &title) |
| |
|
virtual | ~QwtPlotCurve () |
| | Destructor.
|
| |
| virtual int | rtti () const |
| |
| void | setPaintAttribute (PaintAttribute, bool on=true) |
| |
| bool | testPaintAttribute (PaintAttribute) const |
| |
| void | setLegendAttribute (LegendAttribute, bool on=true) |
| |
| bool | testLegendAttribute (LegendAttribute) const |
| |
| void | setRawSamples (const double *xData, const double *yData, int size) |
| | Initialize the data by pointing to memory blocks which are not managed by QwtPlotCurve. More...
|
| |
| void | setSamples (const double *xData, const double *yData, int size) |
| |
| void | setSamples (const QVector< double > &xData, const QVector< double > &yData) |
| | Initialize data with x- and y-arrays (explicitly shared) More...
|
| |
| void | setSamples (const QVector< QPointF > &) |
| |
| void | setSamples (QwtSeriesData< QPointF > *) |
| |
| int | closestPoint (const QPoint &pos, double *dist=NULL) const |
| |
|
double | minXValue () const |
| | boundingRect().left()
|
| |
|
double | maxXValue () const |
| | boundingRect().right()
|
| |
|
double | minYValue () const |
| | boundingRect().top()
|
| |
|
double | maxYValue () const |
| | boundingRect().bottom()
|
| |
| void | setCurveAttribute (CurveAttribute, bool on=true) |
| |
| bool | testCurveAttribute (CurveAttribute) const |
| |
| void | setPen (const QColor &, qreal width=0.0, Qt::PenStyle=Qt::SolidLine) |
| |
| void | setPen (const QPen &) |
| |
| const QPen & | pen () const |
| |
| void | setBrush (const QBrush &) |
| | Assign a brush. More...
|
| |
| const QBrush & | brush () const |
| |
| void | setBaseline (double) |
| | Set the value of the baseline. More...
|
| |
| double | baseline () const |
| |
| void | setStyle (CurveStyle style) |
| |
| CurveStyle | style () const |
| |
| void | setSymbol (QwtSymbol *) |
| | Assign a symbol. More...
|
| |
| const QwtSymbol * | symbol () const |
| |
| void | setCurveFitter (QwtCurveFitter *) |
| |
| QwtCurveFitter * | curveFitter () const |
| |
| virtual void | drawSeries (QPainter *, const QwtScaleMap &xMap, const QwtScaleMap &yMap, const QRectF &canvasRect, int from, int to) const |
| |
| virtual QwtGraphic | legendIcon (int index, const QSizeF &) const |
| |
| | QwtPlotSeriesItem (const QString &title=QString::null) |
| |
| | QwtPlotSeriesItem (const QwtText &title) |
| |
|
virtual | ~QwtPlotSeriesItem () |
| | Destructor.
|
| |
| void | setOrientation (Qt::Orientation) |
| |
| Qt::Orientation | orientation () const |
| |
| virtual void | draw (QPainter *p, const QwtScaleMap &xMap, const QwtScaleMap &yMap, const QRectF &) const |
| | Draw the complete series. More...
|
| |
| virtual QRectF | boundingRect () const |
| |
| virtual void | updateScaleDiv (const QwtScaleDiv &, const QwtScaleDiv &) |
| | Update the item to changes of the axes scale division. More...
|
| |
| | QwtPlotItem (const QwtText &title=QwtText()) |
| |
|
virtual | ~QwtPlotItem () |
| | Destroy the QwtPlotItem.
|
| |
| void | attach (QwtPlot *plot) |
| | Attach the item to a plot. More...
|
| |
| void | detach () |
| | This method detaches a QwtPlotItem from any QwtPlot it has been associated with. More...
|
| |
|
QwtPlot * | plot () const |
| | Return attached plot.
|
| |
| void | setTitle (const QString &title) |
| |
| void | setTitle (const QwtText &title) |
| |
| const QwtText & | title () const |
| |
| void | setItemAttribute (ItemAttribute, bool on=true) |
| |
| bool | testItemAttribute (ItemAttribute) const |
| |
| void | setItemInterest (ItemInterest, bool on=true) |
| |
| bool | testItemInterest (ItemInterest) const |
| |
| void | setRenderHint (RenderHint, bool on=true) |
| |
| bool | testRenderHint (RenderHint) const |
| |
| void | setRenderThreadCount (uint numThreads) |
| |
| uint | renderThreadCount () const |
| |
| void | setLegendIconSize (const QSize &) |
| |
| QSize | legendIconSize () const |
| |
| double | z () const |
| |
| void | setZ (double z) |
| | Set the z value. More...
|
| |
|
void | show () |
| | Show the item.
|
| |
|
void | hide () |
| | Hide the item.
|
| |
| virtual void | setVisible (bool) |
| |
| bool | isVisible () const |
| |
| void | setAxes (int xAxis, int yAxis) |
| |
| void | setXAxis (int axis) |
| |
|
int | xAxis () const |
| | Return xAxis.
|
| |
| void | setYAxis (int axis) |
| |
|
int | yAxis () const |
| | Return yAxis.
|
| |
| virtual void | itemChanged () |
| |
| virtual void | legendChanged () |
| |
| virtual void | getCanvasMarginHint (const QwtScaleMap &xMap, const QwtScaleMap &yMap, const QRectF &canvasSize, double &left, double &top, double &right, double &bottom) const |
| | Calculate a hint for the canvas margin. More...
|
| |
| virtual void | updateLegend (const QwtPlotItem *, const QList< QwtLegendData > &) |
| | Update the item to changes of the legend info. More...
|
| |
| QRectF | scaleRect (const QwtScaleMap &, const QwtScaleMap &) const |
| | Calculate the bounding scale rectangle of 2 maps. More...
|
| |
| QRectF | paintRect (const QwtScaleMap &, const QwtScaleMap &) const |
| | Calculate the bounding paint rectangle of 2 maps. More...
|
| |
| virtual QList< QwtLegendData > | legendData () const |
| | Return all information, that is needed to represent the item on the legend. More...
|
| |
|
| QwtSeriesStore () |
| | Constructor The store contains no series.
|
| |
|
| ~QwtSeriesStore () |
| | Destructor.
|
| |
| void | setData (QwtSeriesData< QPointF > *series) |
| |
| QwtSeriesData< QPointF > * | data () |
| |
| const QwtSeriesData< QPointF > * | data () const |
| |
| QPointF | sample (int index) const |
| |
| virtual size_t | dataSize () const |
| |
| virtual QRectF | dataRect () const |
| |
| virtual void | setRectOfInterest (const QRectF &rect) |
| |
| QwtSeriesData< QPointF > * | swapData (QwtSeriesData< QPointF > *series) |
| |
|
|
void | init () |
| | Initialize internal members.
|
| |
| virtual void | drawCurve (QPainter *p, int style, const QwtScaleMap &xMap, const QwtScaleMap &yMap, const QRectF &canvasRect, int from, int to) const |
| | Draw the line part (without symbols) of a curve interval. More...
|
| |
| virtual void | drawSymbols (QPainter *p, const QwtSymbol &, const QwtScaleMap &xMap, const QwtScaleMap &yMap, const QRectF &canvasRect, int from, int to) const |
| |
| virtual void | drawLines (QPainter *p, const QwtScaleMap &xMap, const QwtScaleMap &yMap, const QRectF &canvasRect, int from, int to) const |
| | Draw lines. More...
|
| |
| virtual void | drawSticks (QPainter *p, const QwtScaleMap &xMap, const QwtScaleMap &yMap, const QRectF &canvasRect, int from, int to) const |
| |
| virtual void | drawDots (QPainter *p, const QwtScaleMap &xMap, const QwtScaleMap &yMap, const QRectF &canvasRect, int from, int to) const |
| |
| virtual void | drawSteps (QPainter *p, const QwtScaleMap &xMap, const QwtScaleMap &yMap, const QRectF &canvasRect, int from, int to) const |
| |
| virtual void | fillCurve (QPainter *, const QwtScaleMap &, const QwtScaleMap &, const QRectF &canvasRect, QPolygonF &) const |
| |
| void | closePolyline (QPainter *, const QwtScaleMap &, const QwtScaleMap &, QPolygonF &) const |
| | Complete a polygon to be a closed polygon including the area between the original polygon and the baseline. More...
|
| |
|
virtual void | dataChanged () |
| | dataChanged() indicates, that the series has been changed.
|
| |
| QwtGraphic | defaultIcon (const QBrush &, const QSizeF &) const |
| | Return a default icon from a brush. More...
|
| |
|
virtual | ~QwtAbstractSeriesStore () |
| | Destructor.
|
| |
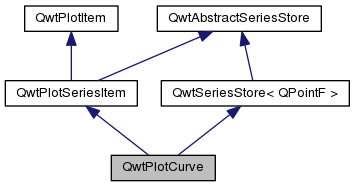
A plot item, that represents a series of points.
A curve is the representation of a series of points in the x-y plane. It supports different display styles, interpolation ( f.e. spline ) and symbols.
- Usage
- a) Assign curve properties
- When a curve is created, it is configured to draw black solid lines with in QwtPlotCurve::Lines style and no symbols. You can change this by calling setPen(), setStyle() and setSymbol().
- b) Connect/Assign data.
- QwtPlotCurve gets its points using a QwtSeriesData object offering a bridge to the real storage of the points ( like QAbstractItemModel ). There are several convenience classes derived from QwtSeriesData, that also store the points inside ( like QStandardItemModel ). QwtPlotCurve also offers a couple of variations of setSamples(), that build QwtSeriesData objects from arrays internally.
- c) Attach the curve to a plot
- See QwtPlotItem::attach()
- Example:
- see examples/bode
- See also
- QwtPointSeriesData, QwtSymbol, QwtScaleMap
 Public Member Functions inherited from QwtPlotSeriesItem
 1.8.11
